Getting to Plan B
I smashed through Getting to Plan B: Breaking Through to a Better Business Model. Below are my notes.
The Process
Find suitable analogs and antilogs, identify leaps of faith time and again, and build a dashboard with metrics to guide your journey and keep track of the results of your hypothesis tests.
- How to rigorously hand systematically stress-test Plan B
- You’ll see how valuable it is to compare your business to other companies - analogs and antilogs
- Dashboarding - methodical way of focusing time and money on removing the critical risks
- Through firsthand evidence reflected in dashboard, either quickly validate vision, or course correct before it’s too late
The Framework
- Five elements of the business model — revenue, gross margin, operating, working capital, and investment model — contain the key to whether your idea and your planned strategy really hold water in economic terms
Notes
This is about mixing and matching analogs and antilogs and identifying and addressing leaps of faith
Four key building blocks of this iterative process
- Analogs
- Antilogs
- Leaps of faith
- Dashboards
Steps
- To begin with, what is the idea you want to pursue?
- Next, consider the analogs to your idea, successful predecessor companies that are worth mimicking in some way
- Next, consider antilogs - predecessor companies compared to which you explicitly choose to do things differently, perhaps because some of what they did has been unsuccessful
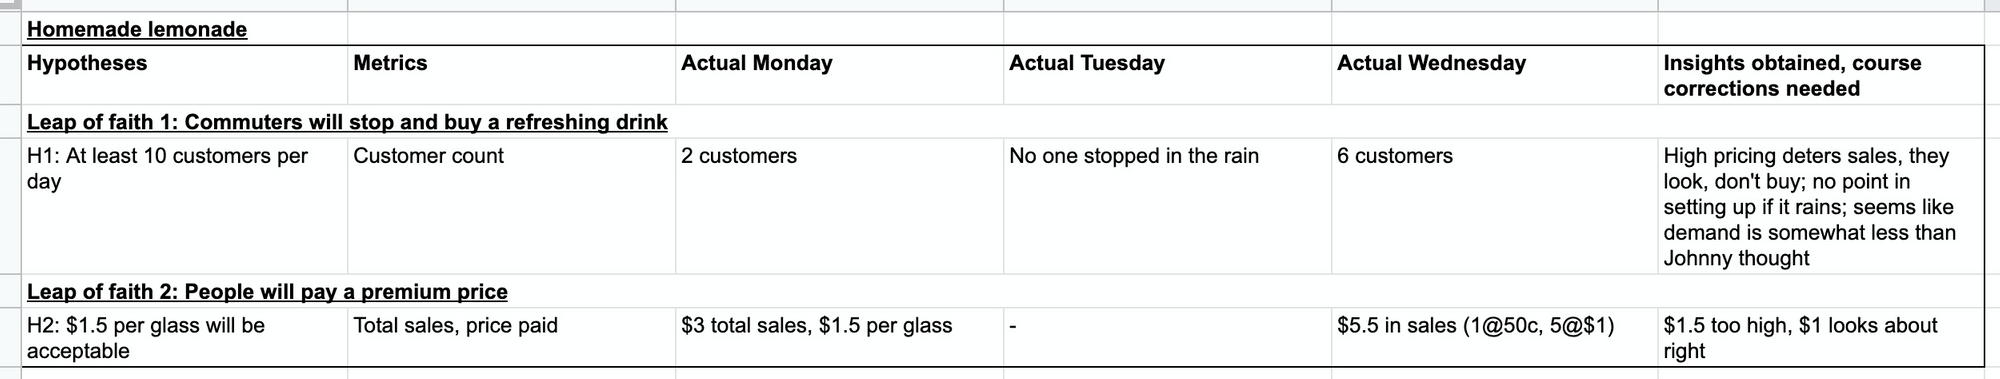
- Leaps of faith. What are the questions you cannot answer from historical precedent? These are beliefs we hold about the answers to our questions despite having no real evidence that these beliefs are actually true. Devise ways to test hypotheses (leaps of faith)
- Adopt a structured, disciplined, and systematic way to guide your set of experiments, track the results as they arise, and provide insight and answers to the questions that underlie your leaps of faith. A dashboard - tool that drives an evidence-based process to plan, guide, and track the results of what you learn from your hypothesis testing
The dashboard: purpose
- Forces you to think strategically about the most crucial issues presently on the table that can - quickly and inexpensively - answer the all important question, “Why won’t this work?”
- Forces you to think rigorously about how you can examine your leaps of faith by testing hypotheses whose results can be measured quantitatively, wherever possible.
- If one or more of your leaps of faith are refuted by the evidence you collect, the results displayed on your dashboard are visible and dramatic indicators of the need to alter your Plan A and move toward Plan B
- A dashboard is a powerful tool for convincing others - of the need to move from Plan A to Plan B
The dasbhoard: building blocks
- Your leaps of faith
- The hypotheses you will test
- The metrics you will use to measure your results
- The results of your hypothesis tests over one or more periods
- The insights you draw for decision-making, based on the results you’ve obtained
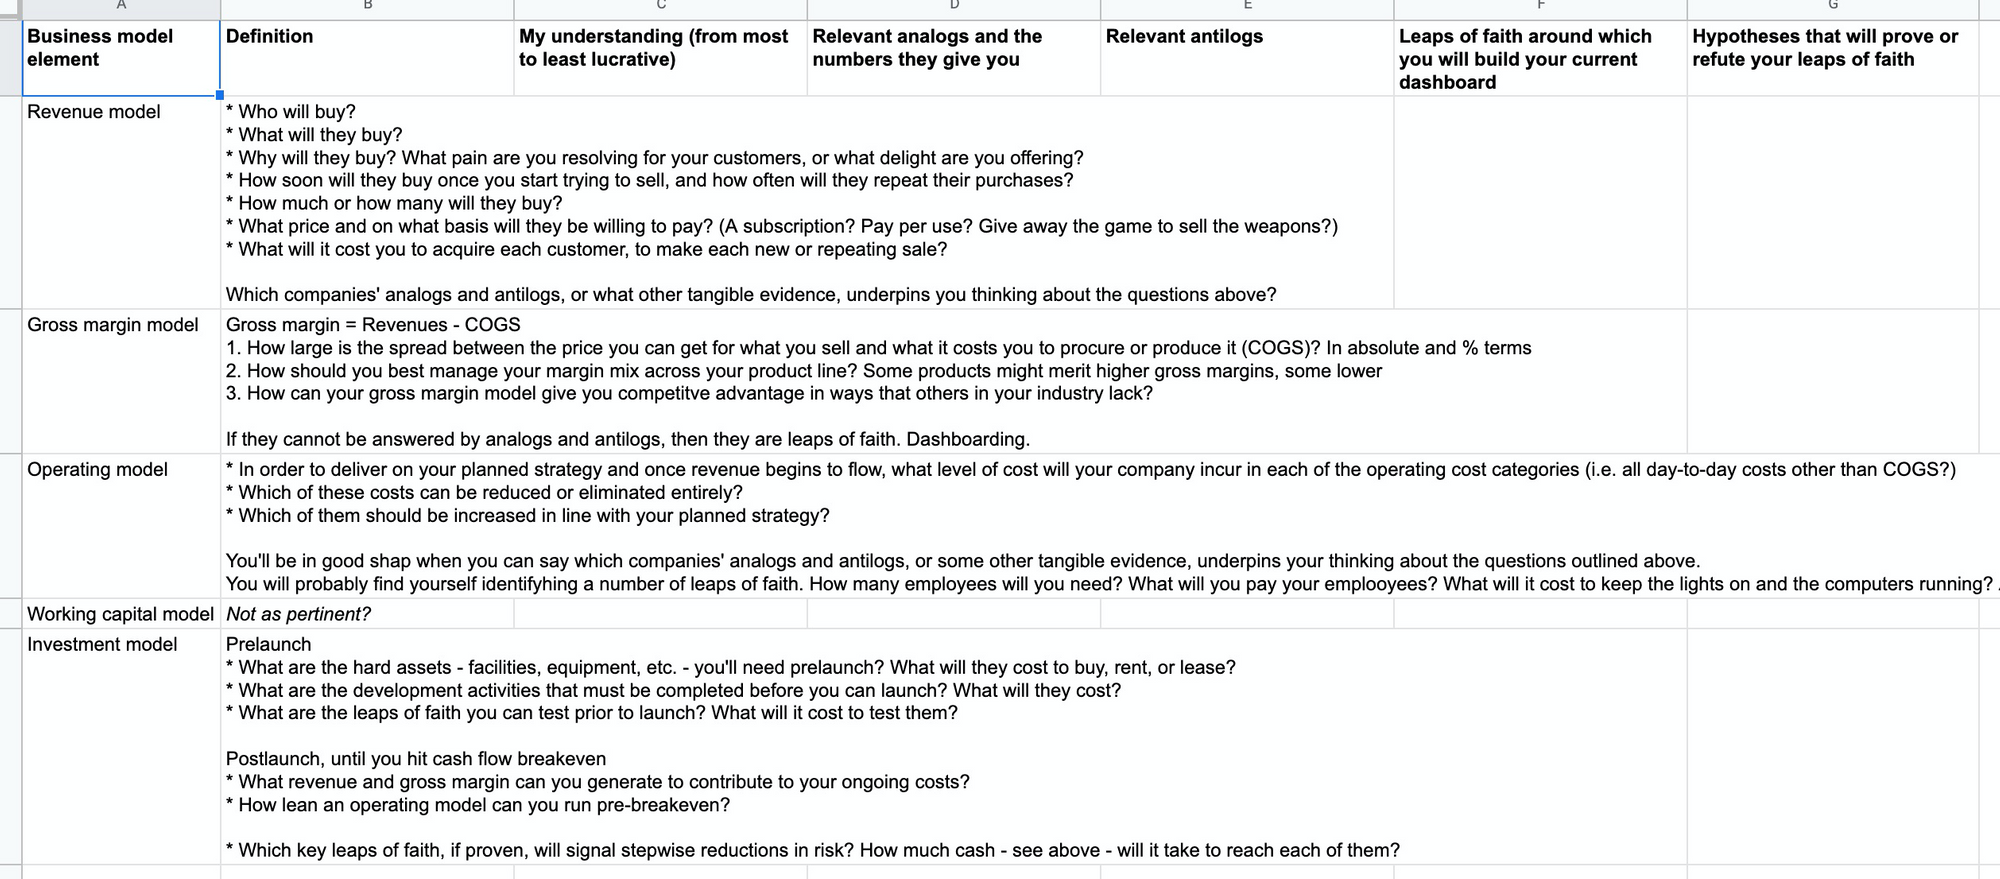
Business Model
- Revenue model - who will buy? How often? How soon? At what cost? How much money will you receive each time a customer buys? And how often will they send you another check? This set of questions will not result in one, tidy number. It will produce many elements that should be supported by an analog or, if not, become a leap of faith and properly considered.
- Gross margin model - How much of your revenue will be left after you had paid the direct costs of what you have sold?
- Operating model - Other than the cost of the goods or services you have sold, what else must you spend money on to support the sale?
- Working capital model - how early can you encourage your customers to pay? Do you have to tipe up money in lots of inventory waiting for customers to buy? can you pay your suppliers later, after the customer has paid?
- Investment model - how much cash must you spend up front before enough customers give you enough business to cover your operating costs?
To get the most out of dashboarding, three things matter the most:
- The quality of the questions you ask to identify your leaps of faith
- What you do with the data
- The speed at which you get on with your next steps
This is not about “business planning” but “business discovering.” Discovery takes discipline, patience, and the right tools for the job.
What tools?
- Some analogs and antilogs from which you will learn
- A few leaps of faith together with hypotheses to prove or refute them
- A sequence of dashboards to guide your journey and mark the need for midcourse corrections
- A mindset that embraces the five business model elements as a framework for organizing what you discover
Putting this book’s lessons to work
Building blocks
- An identified customer pain and a solution that you believe resolves it, or an opportunity to offer customer delight where it is absent today
- Next, some relevant analogs and antilogs, building on what others have done before
- Which lead to some as-yet-untested leaps of faith, clearly prioritized, so you know which to prove - or refute - first
- Which lead to a set of hypotheses to test them
- A dashboard to focus your and your people’s attention on what’s most important right now and to provide the signals for your mid-course corrections
- All comprehensively organized in just the right sequence, to inform and create the five elements of your business model
The business model grid is your organizing framework. Your dashboards are your guide for your discovery journey.
Your task to begin putting flesh on the bones of your entrepreneurial dream, without writing a business plan just yet, is to fill in at least one or more of the cells in each row of the grid.
- For your revenue model, for example, you might have an analog or two that can tell you with some confidence just how, from whom, and at what cost your revenue will be generated. If so, that's the detail — a short paragraph to yourself, including numbers, please — that you need for cell A1.
- Perhaps your analogs and some antilogs lead to a leap of faith that you’ll need to examine experimentally about how your revenue model will play out. If so, that is another paragraph to yourself for cell C1, with your hypothesized answer — again, most of the time with numbers, please — to that leap of faith in cell D1.
A draft of the dashboard you will use to guide your experimental path and signal any necessary midcourse corrections in developing your revenue model is next (see figure 9-2, repeated here from figure 2-1). With these steps completed, you’ll have jump-started your critical thinking about your revenue model.
Next, working a row at a time, repeat the process for your gross margin model, your operating model, your working capital model, and your investment model.
Then, prioritize your set of paragraphs and dashboards, not necessarily in the sequence shown in the business model grid. Which are the most crucial to examine first? Which can wait until earlier answers are in hand? When you are done, for the first time around, what will you have? You’ll have three things
- A series of short paragraphs to yourself that, collectively, describe your Plan A in considerably more detail than the one-liner at the top of the business model grid
- Some dashboards to both set your planned route toward a possible, but as yet unknown, Plan B and to course-correct as your venture evolves
COGS
- For business model purposes, our suggestion: Simply draw a line that, in your particular business, most meaningfully separate the cost of what your customer actually buys from all the other costs, your operating expenses, of being in business, like buying or leasing some airplanes and airport gates.
- For software, COGS as a percentage of sales will be very low, and most expenses will be operating expenses, e.g. cost of CD and pretty box compared to cost of developing the software in the first place